
Ristomanager Statistics. The new installation of our blog will treat the function of the Statistics of Ristomanager, the best method to monitor the results of your activity. Thanks to its powerful filters, you will be able to know the trends of sales even from a single table, in a precise period.

Ristomanager statistics. The new episode of our vlog will deal with the function of Ristomanager Statistics. This is the best method to monitor the activity of your restaurant. Thanks to its powerful filters, you will be able to know in detail the sales trend of even a single table. And also you can do it in a specific period.
Ristomanager Statistics.
You need an easy way for your staff and customers to see how successful it is, so that their efforts towards the same goal are more effective! This is where control statistics come into play – being able to recognize statistical trends helps everyone, from managers to waiters, to understand exactly how each activity is going according to business objectives, as well as providing valuable feedback on potential areas that need improvement or growth opportunities within a given business model.
Ristomanager Statistics are critical to understand the strengths and risks of your business.
Ristomanager Statistics.

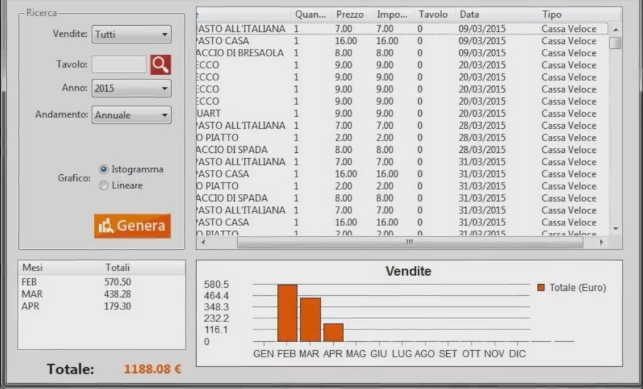
What immediately jumps to the eye when you view the Statistics of Ristomanager, is the completion of the data, which are displayed in a table of clear reading and easy consultation, accompanied in the lower part, by a graph with the trend of sales of a given period, which you can decide before generating the statistics.
Statistics of Ristomanager
The key to success for your restaurant is not only checking statistics, but also paying attention and monitoring what is happening.
Are you curious about how well people are enjoying food? Check out some of these statistics!
1) If customers order more than 30 minutes before closing time, they will get significantly cheaper prices – up to 60% at midnight against 11 pm
2) Seating capacity should be around 48-50 if you want low employee turnover

The Ristomanager statistics allow you to filter data in various ways: you can first choose the type of “Sales” you want to consult, or “Fast Cash” or “Ordinations”, filter sales for a single table (option not available if you choose sales from “Cassa Veloce”), or consult those of a specific “Year”.
It is also possible to establish that the trend should follow the chart below, so you can know the sales of a whole year (previously selected from the appropriate menu) divided by month, or those of a specific month which are selected from the menu that appears choosing the ” “>” Monthly “trend.

All these filters can be easily combined, allowing you to know every detail of your business, for example getting to know the sales and even what was ordered by a hypothetical table called “Fantasia” in a single day of March 2015 .
You can finally choose the type of graph between “Histogram” and “Linear” depending on which you find easier to understand much better . Next to the graph, you will see a list of sales broken down by Months (if you have chosen the “Annual” Trend) or by Days (by choosing the “Monthly” Trend) with the total sales for that period.
In the blog you will find all this information along with many others, so we suggest you to take a look at it by clicking on the image in this same article.
Wishing you a good view, we will meet you at the next episode of our blog!
Read also: Ristomanager: software that manages restaurant reservations